Friday, August 30, 2024

Harmonic Patterns in the Currency Markets

Harmonic price patterns are those that take geometric price patterns to the next level by utilizing Fibonacci numbers to define precise turning points. Unlike other more common trading methods, harmonic trading attempts to predict future movements.

Let's look at some examples of how harmonic price patterns are used to trade currencies in the forex market.

Key Takeaways

  • Harmonic trading refers to the idea that trends are harmonic phenomena, meaning they can subdivided into smaller or larger waves that may predict price direction.
  • Harmonic trading relies on Fibonacci numbers, which are used to create technical indicators.
  • The Fibonacci sequence of numbers, starting with zero and one, is created by adding the previous two numbers:  0, 1, 1, 2, 3, 5, 8, 13, 21, 34, 55, 89, 144, etc.
  • This sequence can then be broken down into ratios which some believe provide clues as to where a given financial market will move to.
  • The Gartley, bat, and crab are among the most popular harmonic patterns available to technical traders.

Geometry and Fibonacci Numbers

Harmonic trading combines patterns and math into a trading method that is precise and based on the premise that patterns repeat themselves. At the root of the methodology is the primary ratio, or some derivative of it (0.618 or 1.618). Complementing ratios include: 0.382, 0.50, 1.41, 2.0, 2.24, 2.618, 3.14 and 3.618. The primary ratio is found in almost all natural and environmental structures and events; it is also found in man-made structures. Since the pattern repeats throughout nature and within society, the ratio is also seen in the financial markets, which are affected by the environments and societies in which they trade.

By finding patterns of varying lengths and magnitudes, the trader can then apply Fibonacci ratios to the patterns and try to predict future movements. The trading method is largely attributed to Scott Carney, although others have contributed or found patterns and levels that enhance performance.

Issues with Harmonics

Harmonic price patterns are precise, requiring the pattern to show movements of a particular magnitude in order for the unfolding of the pattern to provide an accurate reversal point. A trader may often see a pattern that looks like a harmonic pattern, but the Fibonacci levels will not align in the pattern, thus rendering the pattern unreliable in terms of the harmonic approach. This can be an advantage, as it requires the trader to be patient and wait for ideal set-ups.

Harmonic patterns can gauge how long current moves will last, but they can also be used to isolate reversal points. The danger occurs when a trader takes a position in the reversal area and the pattern fails. When this happens, the trader can be caught in a trade where the trend rapidly extends against them. Therefore, as with all trading strategies, risk must be controlled.

It is important to note that patterns may exist within other patterns, and it is also possible that non-harmonic patterns may (and likely will) exist within the context of harmonic patterns. These can be used to aid in the effectiveness of the harmonic pattern and enhance entry and exit performance. Several price waves may also exist within a single harmonic wave (for instance, a CD wave or AB wave). Prices are constantly gyrating; therefore, it is important to focus on the bigger picture of the time frame being traded. The fractal nature of the markets allows the theory to be applied from the smallest to largest time frames.

To use the method, a trader will benefit from a chart platform that allows them to plot multiple Fibonacci retracements to measure each wave.

Types of Harmonic Patterns

There is quite an assortment of harmonic patterns, although there are four that seem most popular. These are the Gartley, butterfly, bat, and crab patterns.

The Gartley

The Gartley was originally published by H.M. Gartley in his book Profits in the Stock Market and the Fibonacci levels were later added by Scott Carney in his book The Harmonic Trader. The levels discussed below are from that book. Over the years, some other traders have come up with some other common ratios. When relevant, those are mentioned as well.


The bullish pattern is often seen early in a trend, and it is a sign the corrective waves are ending and an upward move will ensue following point D. All patterns may be within the context of a broader trend or range and traders must be aware of that.

It's a lot of information to absorb, but this is how to read the chart. We will use the bullish example. The price moves up to A, it then corrects and B is a 0.618 retracement of wave A. The price moves up via BC and is a 0.382 to 0.886 retracement of AB. The next move is down via CD, and it is an extension of 1.13 to 1.618 of AB. Point D is a 0.786 retracement of XA. Many traders look for CD to extend 1.27 to 1.618 of AB.

The area at D is known as the potential reversal zone. This is where long positions could be entered, although waiting for some confirmation of the price starting to rise is encouraged. A stop-loss is placed not far below entry, although addition stop loss tactics are discussed in a later section.

For the bearish pattern, look to short trade near D, with a stop loss not far above.

The Butterfly

The butterfly pattern is different than the Gartley in that the butterfly has point D extending beyond point X. 


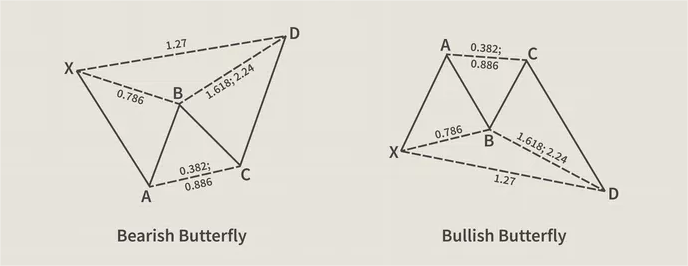
Here we will look at the bearish example to break down the numbers. The price is dropping to A. The up wave of AB is a 0.786 retracement of XA. BC is a 0.382 to 0.886 retracement of AB. CD is a 1.618 to 2.24 extension of AB. D is at a 1.27 extension of the XA wave. D is an area to consider a short trade, although waiting for some confirmation of the price starting to move lower is encouraged. Place a stop loss not far above.

With all these patterns, some traders look for any ratio between the numbers mentioned, while others look for one or the other. For example, above it was mentioned that CD is a 1.618 to 2.24 extension of AB. Some traders will only look for 1.618 or 2.24, and disregard numbers in between unless they are very close to these specific numbers.

The Bat

The bat pattern is similar to the Gartley pattern in appearance but not in measurement. 


Let's look at the bullish example. There is a rise via XA. B retraces 0.382 to 0.5 of XA. BC retraces 0.382 to 0.886 of AB. CD is a 1.618 to 2.618 extension of AB. D is at a 0.886 retracement of XA. D is the area to look for a long, although the wait for the price to start rising before doing so. A stop loss can be placed not far below. 

For the bearish pattern, look to short near D, with a stop loss not far above.

The Crab

The crab is considered by Carney to be one of the most precise of the patterns, providing reversals in extremely close proximity to what the Fibonacci numbers indicate.

This pattern is similar to the butterfly, yet different in measurement.


In a bullish pattern, point B will pullback 0.382 to 0.618 of XA. BC will retrace 0.382 to 0.886 of AB. CD extends 2.618 to 3.618 of AB. Point D is a 1.618 extension of XA. Take longs near D, with a stop loss not far below.

For the bearish pattern, enter a short near D, with a stop loss not far above.

Fine-Tune Entries and Stop Losses

Each pattern provides a potential reversal zone (PRZ), and not necessarily an exact price. This is because two different projections are forming point D. If all projected levels are within close proximity, the trader can enter a position at that area. If the projection zone is spread out, such as on longer-term charts where the levels may be 50 pips or more apart, look for some other confirmation of the price moving in the expected direction. This could be from an indicator, or simply watching price action.

A stop loss can also be placed outside the furthest projection. This means the stop loss is unlikely to be reached unless the pattern invalidates itself by moving too far.

Thursday, August 22, 2024

3 Simple Strategies for Euro Traders

Euro (EUR) traders speculate on the strength of the Eurozone economy, compared to its major partners. The relationship between the euro (EUR) and the U.S. dollar (USD) marks the most liquid forex pair in the world, with tight spreads and broad price movement that supports a continuous flow of profitable opportunities.

While there are many ways to trade the EUR/USD pair, three simple strategies have been consistently effective. These can be executed by forex traders of all skill levels. Newer participants can reduce position size to control risk while experienced players can increase the size to take full advantage of the opportunities.

Key Takeaways

  • The EUR/USD currency pair is the most liquid forex pair in the world.
  • EUR/USD transactions represent approximately one quarter of all forex trades.2
  • Three basic ways to trade the EUR/USD can be executed by forex traders of all skill levels.
  • Newer forex traders can reduce position size to control risk.
  • More experienced players can increase position size to take full advantage of profit opportunities.

1. Buy the Pullback or Sell the Pullback

The EUR/USD trend thrusts in both directions and carries the price from one level to another in a positive feedback loop that can generate considerable momentum.

However, this rapid movement tends to fizzle out when the supply/demand equation shifts, often trapping latecomers in positions that will be executed for losses when the currency pair reverses and heads in the opposite direction.

The pullback strategy takes advantage of this countertrend movement. It involves identifying significant support or resistance levels that can end the price swing and reinstate the initial trend direction.

These levels often come at prior highs or lows as well as at key levels defined by Fibonacci retracements, moving averages, and the inception point of the original thrust.

2. Buy the Breakout and Sell the Breakdown

The EUR/USD pair often grinds back and forth within confined boundaries for extended periods, setting up well-defined trading ranges that will eventually yield new trends, higher or lower.

Patience during these consolidation phases often pays off with low-risk trade entries when support or resistance finally breaks, giving way to a strong rally or selloff.

Good timing is needed to take full advantage of this simple strategy. Enter too early and the range could hold and trigger a reversal. Enter too late and you risk executing well above new support or well below new resistance.

It’s often a good idea to reduce timing risk by opening a partial position when the pair breaks out or down and adding to it on the first minor retracement.

FAST FACT

The U.S. dollar (USD) is the world's most dominant currency: as of 2019, it's on one side of 88% of all forex trades. The euro (EUR) is the next most traded and is in 32% of all global trades.

3. Enter Narrow Range Patterns

EUR/USD will often rise or fall into a significant barrier and then go to sleep, printing narrow range price bars that lower volatility and raise apathy levels.

Coincidentally, this quiet interface often marks a powerful entry signal for a breakout or breakdown. Using this strategy, a trader enters the position within the narrow range pattern, with a tight stop in place in case of a major reversal. 

This setup often prints an NR7 bar, which marks the narrowest range price bar of the last seven bars. Originally observed in the U.S. futures markets in the 1950s, this powerful but simple pattern predicts that price bars will expand in a sizable breakout or breakdown. It’s also a low-risk entry because the stop loss can be set very close to the entry price.

What Is the EUR/USD?

EUR/USD is a currency pair. It represents the relationship between the two most highly traded currencies in the world. In terms of value, a quote for EUR/USD will indicate the amount of U.S. dollars needed to buy 1 euro.

What Affects the Value of EUR/USD?

The EUR/USD currency pair exchange rate can be affected by economic and political conditions in the U.S. and the countries of the eurozone. Actions by the Federal Reserve and the European Central Bank can influence the spread. So can monetary policies of countries with major economies, such as Germany. To trade effectively, it's important for traders and investors to stay on top of what's happening on both sides of the Atlantic.

Can Technical Analysis Help Those Trading the EUR/USD?

Both fundamental analysis and technical analysis can inform forex trading and investment decision-making. Fundamental analysis involves using economic data to set trade entry and exit points. Technical analysis uses chart patterns of price action and associated technical indicators to time executions. Technical analysis may be extra helpful for those who trade actively in the highly liquid, fast moving forex market. However, you're not limited to one type of analysis or the other.

Strategies for Part-Time Forex Traders

Very few people are available to trade forex full time. Traders who have to make their trades at work, lunch, or night find that with such a fluid market, trading sporadically throughout a small portion of the day creates missed opportunities to buy or sell. These missed opportunities can spell disaster for the part-time trader.

The risk of missed opportunities notwithstanding, there are strategies that can work based on a part-time schedule. For example, those who trade at night might be limited to the types of currencies they trade based on volumes during the 24-hour cycle. These night traders should employ a strategy of trading specific currency pairs that are most active overnight.

An example would be trading the Australian dollar (AUD) / Japanese yen (JPY) pair or the New Zealand dollar (NZD)/JPY or AUD pair. It is important to analyze the correlation between currencies when choosing a pair, as having time during the day to study the market and implement trades can lead to a successful strategy.

The main problem as a part-time trader is—you guessed it—time constraints. Here are some strategies for trading part-time when you have an inconsistent schedule.

Key Takeaways

  • Forex markets trade around the clock, 24/7. Unless you're a professional trader, you simply don't have the manpower or time to keep your eyes always on the market.
  • Fortunately, several basic strategies exist to allow part-time traders to stay active and protect their positions even when they are away from their screens or even asleep.
  • Stop-loss orders and automated trade entry from electronic trading platforms are just two ways to trade when you're a part-timer.

Know Your Forex Markets

Assuming you work nine to five in the U.S., you could trade before or after work. The best trading strategy in those time blocks is to pick the most active currency pairs (those with the most price action). Knowing what times the major currency markets are open will aid in choosing major pairs.

New York is open from 8:00 a.m. to 5:00 p.m. EST
Tokyo is open from 7:00 p.m. to 4:00 a.m. EST
Sydney is open from 5:00 p.m. to 2:00 a.m. EST
London is open from 3:00 a.m. to 12:00 noon EST

The markets in Japan and Europe (open 2:00 a.m.–11:00 a.m.) are in full swing so part-time traders can choose major currency pairs. These include the EUR/JPY pair or the EUR/ CHF pair for major currencies or pairs that involve the Hong Kong dollar (HKD) or Singapore dollar (SGD).

The AUD/JPY pair might also work well for part-time traders available during the 5 p.m. to midnight timeframe. While it is crucial to understand the best currency pairs that fit your schedule, before placing any bets the trader needs to conduct further analysis on these pairs and the fundamentals of each currency.

Stop-Loss Orders in Forex Trading

The best strategy for part-time traders may be to let your computer be your "trading partner." The ability to employ a trading program where you can let the information technology work for you could be beneficial, as the forex market is so fluid and difficult to monitor. Another common strategy is to implement stop-loss orders, which means that if the market takes a sudden move against your position, your money is protected.

Price Action in Forex

There is also a strategy for part-time traders who pop in and out of work (10 minutes at a time). These brief but frequent trading periods may lend themselves to implementing a price action trading strategy. Price action trading means analyzing the technicals or charts of the currency pair to inform trades. Traders can analyze up bars (a bar that has a higher high or higher low than the previous bar) and look at down bars (a bar with a lower high or lower low than the previous).

Up bars signal an uptrend while down bars signal a downtrend, while other price action indicators may be inside or outside bars. The key to success with this strategy is trading off of a chart timeframe that best meets your schedule.

Other Forex Trading Strategies

These strategies may also serve you well as a part-time forex trader:

  • Take fewer positions and hold for days.
    It is critical that you understand the drivers of your currency pairs and have taken the time to really understand your market. Therefore, after studying the market and narrowing down particular chosen currency pairs, selecting a few positions and holding them for a longer period of time is a prudent strategy for part-timers. Another wise strategy is to put in stop-loss orders with all your trades to minimize any losses if the market moves against you.
  • Look at long-term trends.
    There is value in looking at longer-term trends (daily/weekly) instead of looking at hourly or even four-hour charts. This will allow you to trade while looking at your computer only once a day.
  • Set up trading orders.
    Setting limit, stop-loss, or other entry/exit orders can ensure you do not miss opportunities to enter or exit positions. Most trading platforms allow for these orders with no additional fees.
  • Use technology!
    Set up automated alerts to your mobile phone or email to keep you informed of currency price movements while you are not actively trading.

Can Forex Trading Make You Rich?

Being a regular retail forex trader is a difficult path to becoming rich. Currencies are impacted by many factors and so it can be difficult to predict the movement of a currency, particularly when surprise events occur. In addition, the forex market is not centralized and with that comes its own risks. A significant amount of information is needed to trade forex successfully and that type of information is not readily available to the average forex trader. Now, if you are a large financial institution or investment fund, then the possibility of becoming rich through forex trading exists.

What Is FX and How Does It Work?

"FX" refers to foreign exchange and specifically foreign exchange trading. Because the world is interconnected and commerce spans across all nations, foreign exchange is the most liquid and largest financial market in the world. FX refers to buying and selling currencies, which is done through currency pairs.

How Much Do Foreign Exchange Traders Make?

The amount that a foreign exchange trader makes will vary depending on how much trading the trader does, the institution that they work at, if they trade alone, and how successful they are. The average salary for an FX trader is $108,750. The salary ranges from $21,025 to $558,741.

9 Forex Trading Tips

The best traders hone their skills through practice and discipline. They also perform self-analysis to see what drives their trades and learn how to keep fear and greed out of the equation. These are the skills any forex trader should practice.

Key Takeaways

  • Trading forex can be a way to diversify a broader portfolio of holdings.
  • Traders can benefit from specific FX strategies.
  • Traders alike must keep in mind that practice, knowledge, and discipline are key to getting and staying ahead in Forex trading.

Define Goals and Trading Style

Before you set out on any journey, it is imperative to have some idea of your destination and how you will get there. Consequently, it is imperative to have clear goals in mind, then ensure your trading method is capable of achieving these goals. Each trading style has a different risk profile, which requires a certain attitude and approach to trade successfully.

For example, if you cannot stomach going to sleep with an open position in the market, then you might consider day trading. On the other hand, if you have funds you think will benefit from the appreciation of a trade over a period of some months, you may be more of a position trader. Just be sure your personality fits the style of trading you undertake. A personality mismatch will lead to stress and certain losses.

The Broker and Trading Platform

Choosing a reputable broker is of paramount importance, and spending time researching the differences between brokers will be very helpful. You must know each broker's policies and how they go about making a market. For example, trading in the over-the-counter market or spot market is different from trading the exchange-driven markets.

Also, make sure your broker's trading platform is suitable for the analysis you want to do. For example, if you like to trade off Fibonacci numbers, be sure the broker's platform can draw Fibonacci lines. A good broker with a poor platform, or a good platform with a poor broker, can be a problem. Make sure you get the best of both.

A Consistent Methodology

Before you enter any market as a trader, you need to know how you will make decisions to execute your trades. You must understand what information you will need to make the appropriate decision on entering or exiting a trade. Some traders choose to monitor the economy's underlying fundamentals and charts to determine the best time to execute the trade. Others use only technical analysis.

Whichever methodology you choose, be consistent and be sure your methodology is adaptive. Your system should keep up with the changing dynamics of the market.

Determine Entry and Exit Points

Many traders get confused by conflicting information that occurs when looking at charts in different timeframes. What shows up as a buying opportunity on a weekly chart could show up as a sell signal on an intraday chart.

Therefore, if you are taking your basic trading direction from a weekly chart and using a daily chart for time entry, be sure to synchronize the two. In other words, if the weekly chart is giving you a buy signal, wait until the daily chart also confirms a buy signal. Keep your timing in sync.

Calculate Your Expectancy

Expectancy is the formula you use to determine how reliable your system is. You should go back in time and measure all your trades that were winners versus losers, then determine how profitable your winning trades were versus how much your losing trades lost.

Take a look at your last ten trades. If you haven't made actual trades yet, go back on your chart to where your system would have indicated that you should enter and exit a trade. Determine if you would have made a profit or a loss. Write these results down.

Although there are a few ways to calculate the percentage profit earned to gauge a successful trading plan, there is no guarantee that you'll earn that amount each day you trade since market conditions can change. However, here's an example of how to calculate expectancy:

Formula for Expectancy

Expectancy = (% Won * Average Win) - (% Loss * Average Loss)

Example of Expectancy

If you made ten trades, six of which were winning trades and four of which were losing trades, your percentage win ratio would be 6/10 or 60%.

  • If your six trades made $2,400, then your average win would be $400 ($2,400/6).
  • If your losses were $1,200, then your average loss would be $300 ($1,200/4).

Expectancy = (% Won * Average Win) - (% Loss * Average Loss)

  • Expectancy: (.60 * $400) - (.40 * $300) = $120

In other words, on average, a trader could expect to earn $120 per trade.

Risk:Reward Ratio

Before trading, it's important to determine the level of risk that you're comfortable taking on each trade and how much can realistically be earned. A risk-reward ratio helps traders identify whether they have a chance to earn a profit over the long term.

For example, if the potential loss per trade is $200 and the potential profit per trade equals $600, the risk-reward ratio would equal 1:2.

  • If ten trades were placed and a profit was earned on just four of the ten trades, the total profit would equal $2,400 ($600*4).
  • As a result, six of the ten trades would've lost money at $200 each, which equals $1,200 in total losses ($200*6).
  • In other words, a trader would earn a profit on the ten trades despite being correct only 40% of the time.

Stop-Loss Orders

Risk can be mitigated through stop-loss orders, which exit the position at a specific exchange rate. Stop-loss orders are an essential forex risk management tool since they can help traders cap their risk per trade, preventing significant losses.

Using the example above, imagine the trader had a very wide stop-loss order for each trade, meaning they were willing to risk losing $1,200 per trade but still made $600 per winning trade. One loss could wipe out two winning trades. If the trader experienced a series of losses due to being stopped-out from adverse market moves, a far higher and unrealistic winning percentage would be needed to make up for the losses.

Although it's important to have a winning trading strategy on a percentage basis, managing risk and potential losses is also critical so that they don't wipe out your brokerage account.

Focus and Small Losses

Once you have funded your account, the most important thing to remember is your money is at risk. Therefore, your money should not be needed for regular living expenses. Think of your trading money like vacation money. Once the vacation is over, your money is spent. Have the same attitude toward trading. This will psychologically prepare you to accept small losses, which is key to managing your risk. By focusing on your trades and accepting small losses rather than constantly counting your equity, you will be much more successful.

Positive Feedback Loops

A positive feedback loop is created as a result of a well-executed trade in accordance with your plan. When you plan a trade and execute it well, you form a positive feedback pattern. Success breeds success, which in turn breeds confidence, especially if the trade is profitable. Even if you take a small loss but do so in accordance with a planned trade, then you will be building a positive feedback loop.

Perform Weekend Analysis

On the weekend, when the markets are closed, study weekly charts to look for patterns or news that could affect your trade. Perhaps a pattern is making a double top, and the pundits and the news are suggesting a market reversal. This is a kind of reflexivity where the pattern could be prompting the pundits, who then reinforce the pattern. In the cool light of objectivity, you will make your best plans. Wait for your setups and learn to be patient.

Keep a Printed Record

A printed record is a great learning tool. Print out a chart and list all the reasons for the trade, including the fundamentals that sway your decisions. Mark the chart with your entry and your exit points. Make any relevant comments on the chart, including emotional reasons for taking action. Did you panic? Were you too greedy? Were you full of anxiety? It is only when you can objectify your trades that you will develop the mental control and discipline to execute according to your system instead of your habits or emotions.